

 OpenRules Decision Model Explorer is a Graphical Integrated Decision Modeling Environment that provides business users with the following functionality:
Each OpenRules Decision Manager project includes the batch file “explore.bat” that starts the Explorer. For example, the above Explorer’s view will be displayed when you double-click on this file from the standard decision project “PatientTherapy“. You can click on the icon ![]() in the title bar to Open any other decision project.
in the title bar to Open any other decision project.
Diagramming
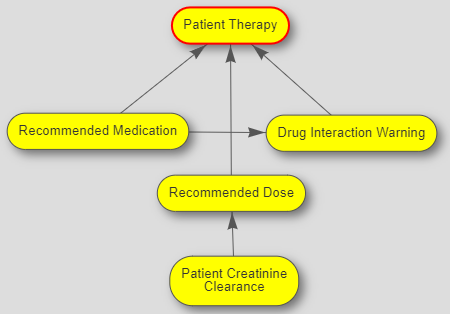
When you open OpenRules Explorer from the folder with an existing decision model for the first time, it will generate its diagram using only goals and sub-goals. This diagram reflects the Goal-Oriented Decision Modeling approach described in this book and in general follows the DMN (Decision Model and Notation) graphical convention for decision requirement diagrams. All goals are shown as yellow rounded rectangles and the main goals has a red border. The arrows between goals show the automatically (!) discovered knowledge relationships, e.g. the goal “Recommended Dose” depends on the sub-goal “Patient Creatinine Clearance”.
You don’t have to draw the diagram yourself as it’s being AUTOMATICALLY generated based on already defined glossary, goal/sub-goals, and tables that specify their logic. You may freely move the diagram elements around and the Explorer will keep all relationships between them (arrows) in tact.
A double-click on any node inside the diagram opens the corresponding Excel file where this decisioning element (Goal, Table, Input, or Business Concept) is defined. When you make changes in Excel they will be immediately reflected on the diagram.
 Diagram Views
You may create different diagram views of the same decision model by selecting different elements from the legend on the right. For example, if you select only “Goals” in the legend, the diagram may look as follows:
If you also select “Tables“, all related decision tables (and other business knowledge model elements such as “Decision”, “DecisionService”, “Code”, “Method”) will be shown as blue rectangles:
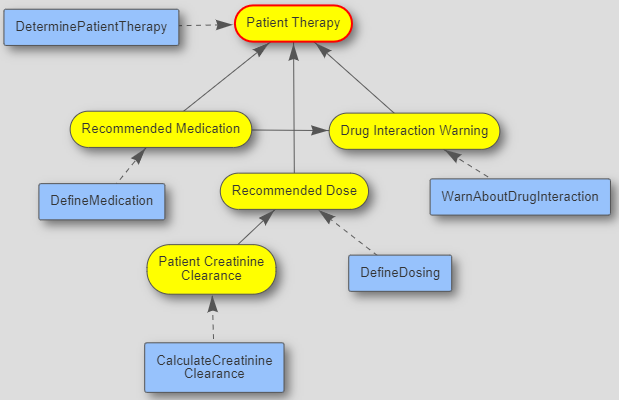
The dashed arrows from a blue table to a goals prompts you that this table contains the logic that specifies this goal.
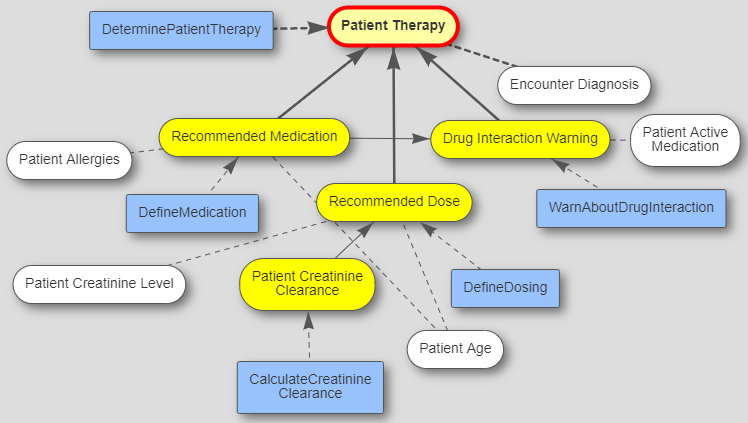
You may also select “Input“, then all decision variables will be shown as white rounded rectangles with dashed lines to the goals that use them:
You may hide the “Input Data” and select “Concepts” to show the business concepts described in your glossary. They will be shown as pink rounded rectangles:
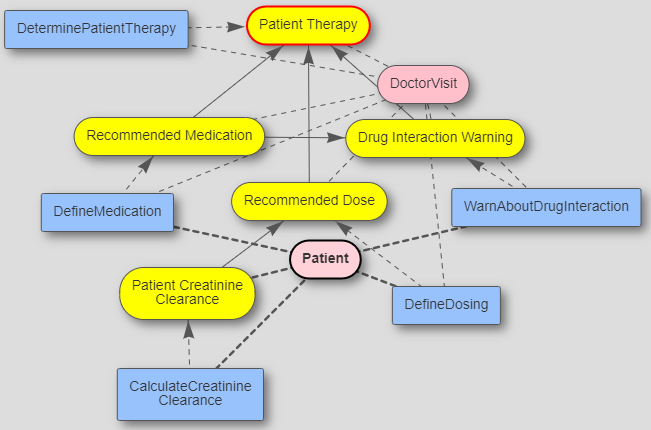
When you click on an concept or an input node all related dashed links will be highlighted.
A double-click on a blue node such as “DefineMedication” will open a view with the proper decision table: 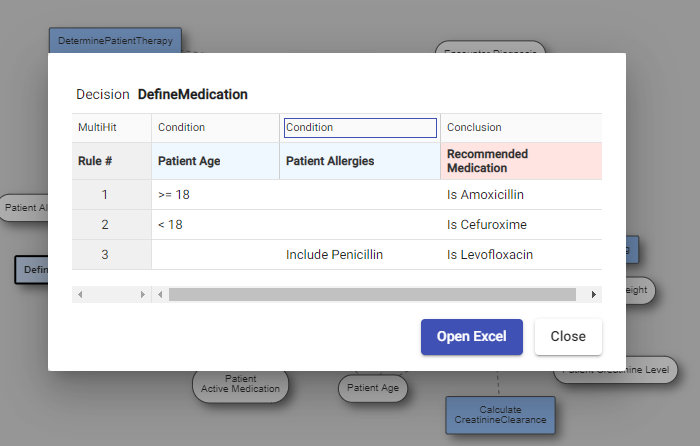
You may adjust the width of any column and click on the left of any rule to setup a breakpoint for the debugging. If you want to modify this table, click on “Open Excel”.
Diagram Manipulations
You can easily adjust diagrams in many ways. You may drag & drop any nodes and all automatically calculated links (arrows) will stay intact. You may use the following buttons to move the diagram around, zoom in/out, or to put it in the center:
You can click on the button “Export PDF” to export the diagram to the PDF format in the file of your choice.
Here is an example of the automatically generated diagram for a more complex decision model “Bureau Strategy” used in our sample decision model library for the Loan Origination domain:

In this example decision models “Bureau Strategy” and “Routing” are deployed as AWS Lambda decision services and then these two services are used by the decision model “Loan Origination Result” described at this diagram:
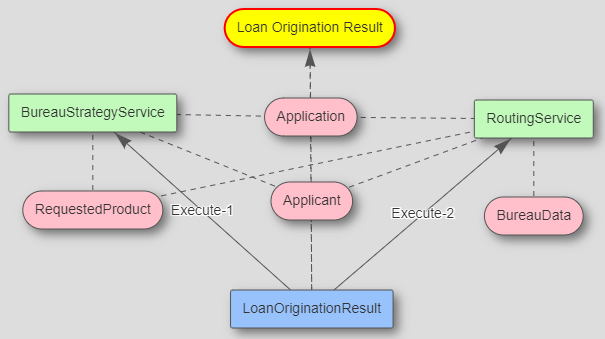
This decision model is not aware of the internal structure of these two decision services which are shown as green rectangles. However, we can see the decision table “LoanOriginationResult” that invokes these services and business concepts (pink rounded rectangles) used by these services.
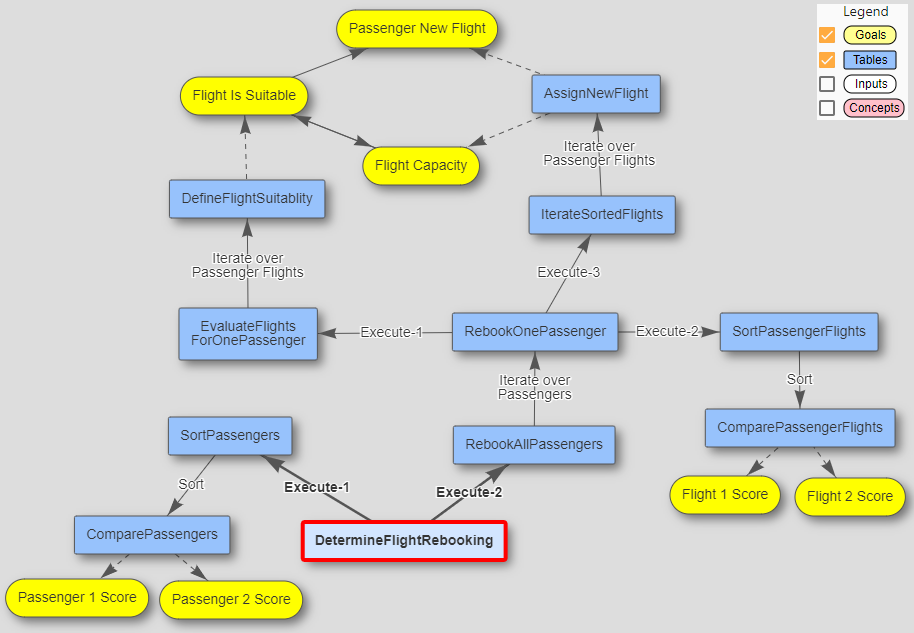
When a decision model iterates over collections of objects and sorts some of them like in a quite complex decision model “Flight Rebooking“, the automatically generated diagram explains complex relationships by putting clarifying labels “Iterate”, “Execute”, and “Sort” on the proper links:
The generated diagrams are being automatically updated whenever decision logic in the underlying Excel tables is changed (without a refresh-button). If OpenRules Explorer recognizes missing nodes it shows them in red. Watch the video that demonstrates how OpenRules Explorer keeps decision model diagrams LIVE.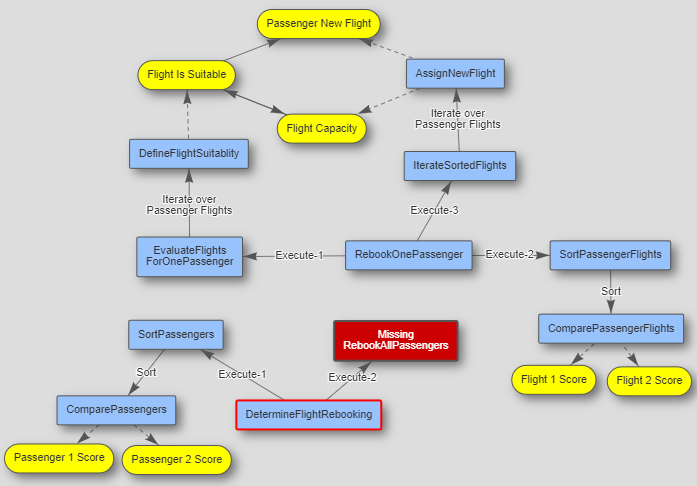
You can test your decision model directly from the Explorer by running test cases defined in Excel. Click on the icon ![]() and you will see a view similar to this one:
and you will see a view similar to this one:

The left panel “Run Tests” shows all available test cases which you can open in Excel by clicking on the test name. The panel “Execution Path” shows all major execution steps (usually rulesets such as decision tables) in the automatically defined order.
You can execute ALL TESTS or only selected test cases. To execute a test case you may click on the corresponding icon ![]() and you will see the results on the Execution Console. You may click on the tab “Execution Report” to see the automatically generated reports that show only actually executed rules with pointers to the places in Excel where they are defined, brief rules formulations, and all involved decision variables with their values in the time of the rule execution:
and you will see the results on the Execution Console. You may click on the tab “Execution Report” to see the automatically generated reports that show only actually executed rules with pointers to the places in Excel where they are defined, brief rules formulations, and all involved decision variables with their values in the time of the rule execution:
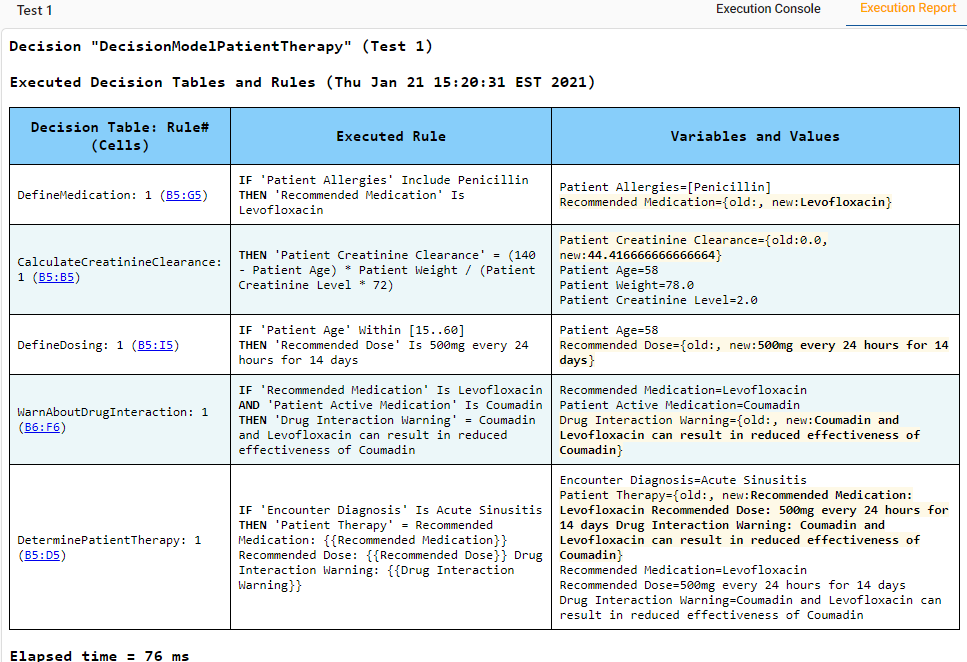
This information provides detailed explanation of what and why was executed.
You can debug your decision model by click on the Debug-button ![]() :
:

See the detailed description of OpenRules Debugger or watch the video.
 OpenRules Decision Manager allows you to deploy your decision model as a regular Java program on-premise or on-cloud using the following deployment options:
You can deploy your decision model directly from the Explorer using the “Deploy” menu-item ![]() . You will see a view similar to this one:
. You will see a view similar to this one:

Upcoming Features
The future releases of the Explorer will support the following features:
-
- Creation of New Decision Models
- Collapse/Expand – you will be able to collapse/expand selected nodes and their dependencies
- Properties and Settings – you will be able to modify the file “project.properties” and the Explorer settings
- Advanced Deployment
Availability
The current implementation works only under Windows as it uses VB scripts to open Excel files.
We are working on an online version of OpenRules Explorer when you will be able to upload your decision model on cloud and work with it without any downloads. We also plan to make it available under Mac and Linux.
