


Motivation
If you are an author of a real-world business decision model, you may have troubles to understand why certain rules inside your model were not executed while others did. When complex logical errors occur, even the best explanation reports and execution traces could be difficult to follow. What you need is a Rule Debugger!
To deal with complex logical errors, software developers usually rely on very powerful Code Debuggers. However, business users don’t deal with executable code. What they need is a powerful while easy to use Rule Debugger to debug their business logic in business terms without becoming de-facto programmers.
OpenRules Rule Debugger is the tool that helps business users to figure out what is going wrong with their business logic as fast as possible. It allows them to step through the execution of their business decision models, pause the execution at any rule or ruleset, and inspect the state of the decision model. And it provides all this functionality with ease-of-use!
Rule Debugger is a component of OpenRules Explorer, an integrated graphical decision management environment. To show the debugger in action, we’ll use different decision models form the standard OpenRules samples.
Running and Debugging Sample Decision Model
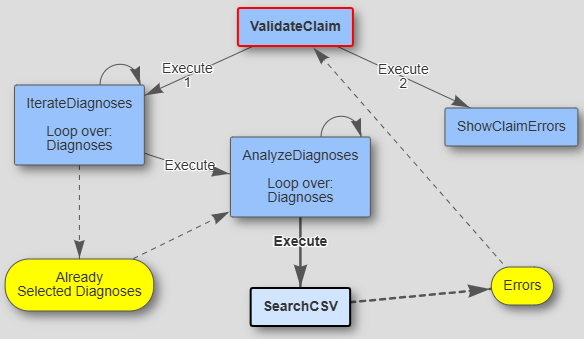
To open OpenRules Explorer, double-click on “explore.bat” inside the standard sample “ICD10” from “openrules.samples”. You will see this decision model diagram similar to this one:
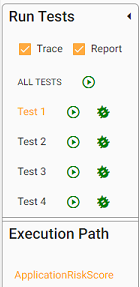
To test this model, click on the icon “Run” ![]() in the title bar. The Test View will be opened from which you can Run or Debug this model against different test cases – it is shown on the top of this page. The left panel contains all available test cases under the title “Run Tests“. These tests are defined in an Excel table that can be opened when you click on the test’s name. It also contains “Execution Path” that shows the sequence of decision tables in the order that was automatically defined or specified by the author of the decision model.
in the title bar. The Test View will be opened from which you can Run or Debug this model against different test cases – it is shown on the top of this page. The left panel contains all available test cases under the title “Run Tests“. These tests are defined in an Excel table that can be opened when you click on the test’s name. It also contains “Execution Path” that shows the sequence of decision tables in the order that was automatically defined or specified by the author of the decision model.
Click on the “Run” button, and then on a green circle ![]() near the test case “Test 1”.
near the test case “Test 1”.
The Explorer will execute the decision model against this test and will show this “Execution Console“:

You can scroll through this simplified execution protocol that shows all executed rules and their execution results. A much better view will be shown when you click of the “Execution Report” at the top right corner:
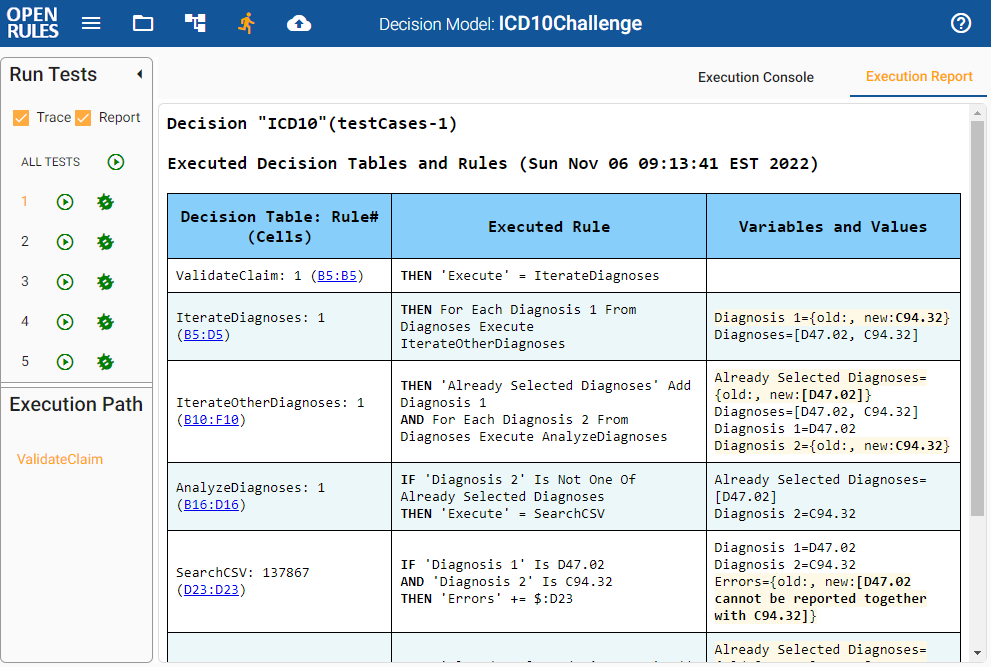
This report shows all executed rulesets (decision tables) and rules along with values of related decision variables in the moment when these rules were executed. Our customers love this report and use it for explanations.
However, when this report is too big, it’s still difficult to analyze it. Instead, you may switch to the Rule Debugger.
Stepping Through Execution Flow

Click on the “Debug” button (a green “bug” next to the Test 1).
The Explorer will start a debug session during which you may use buttons like “Next Rule” or “Next Active Rules” to execute rules one-by-one, analyze all related decision variables, and see the execution path graphically as shown on this Debug View:
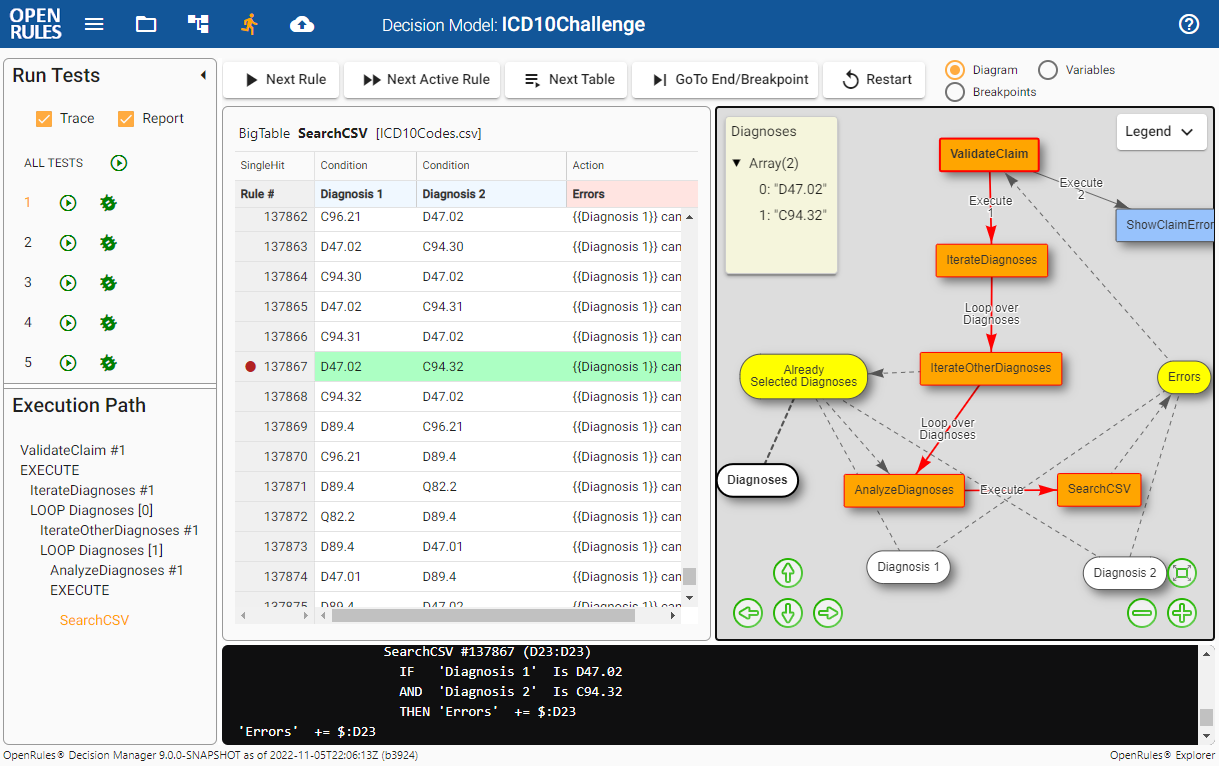
This view consists of four panels and menu buttons on the top.
Left Panel allows you to choose which test to debug and shows the “Execution Path” for the currently executed decision tables.
Central Panel shows a decision table that is currently being executed. Initially, the debugger stops before (!) executing the very first rule in green:
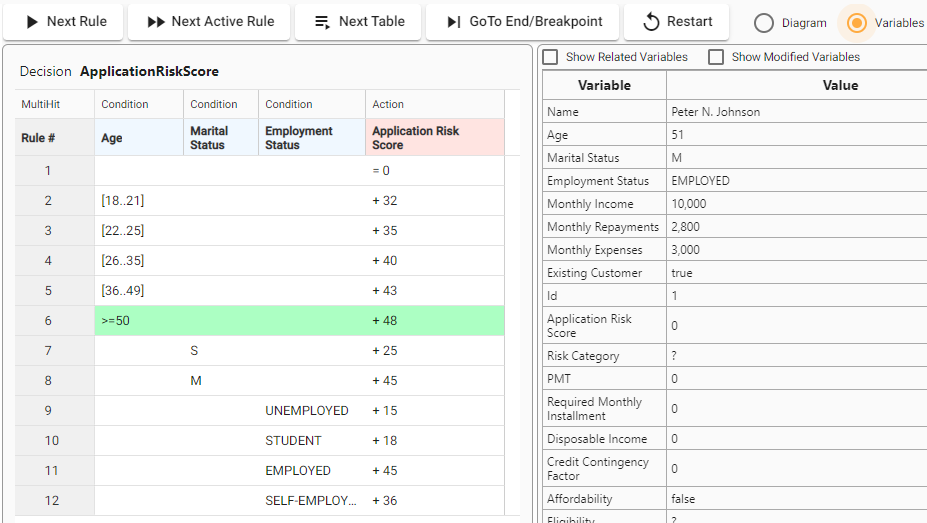
By click on the button “Next Rule” you may navigate through all rules. For example, when you reach Rule #6, it will be highlighted as “green” because the Age is 51 >= 50. It means the rule is about to be executed.
If the rule is about to be skipped, it will be highlighted as “yellow” and the column in which the rule is being violated shows the proper condition in red.
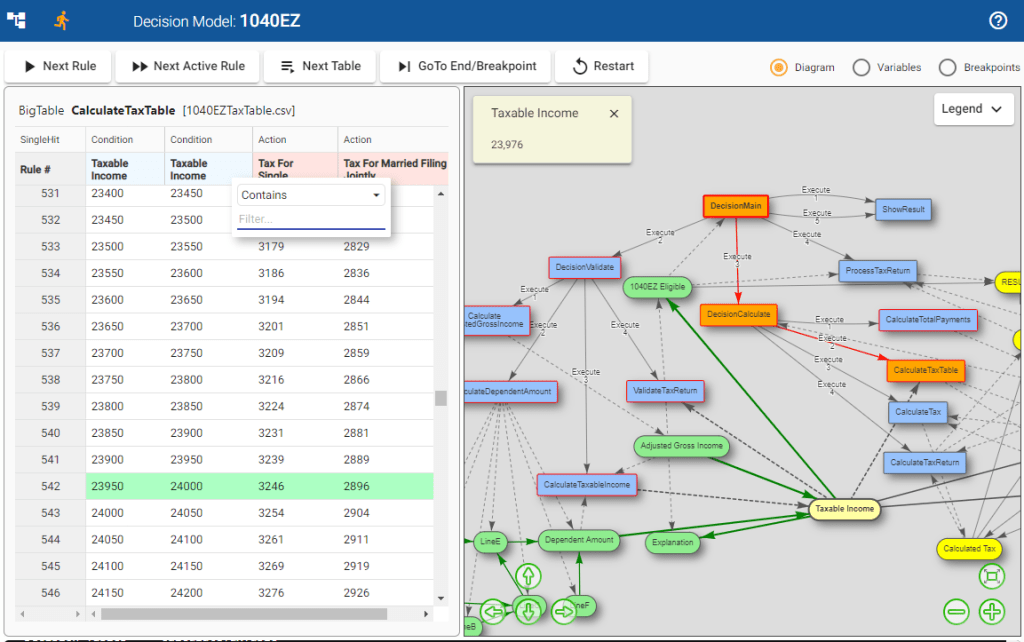
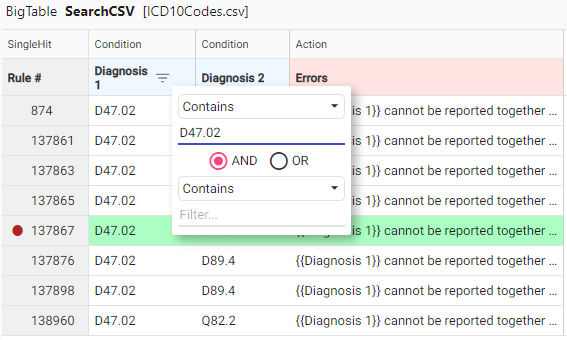
If the decision table is too big to be seen without scrolling you may use filters by a click on the 3 lines inside the column title as on the following view:
Low Panel (the black one) displays the execution protocol as you navigate through rules.
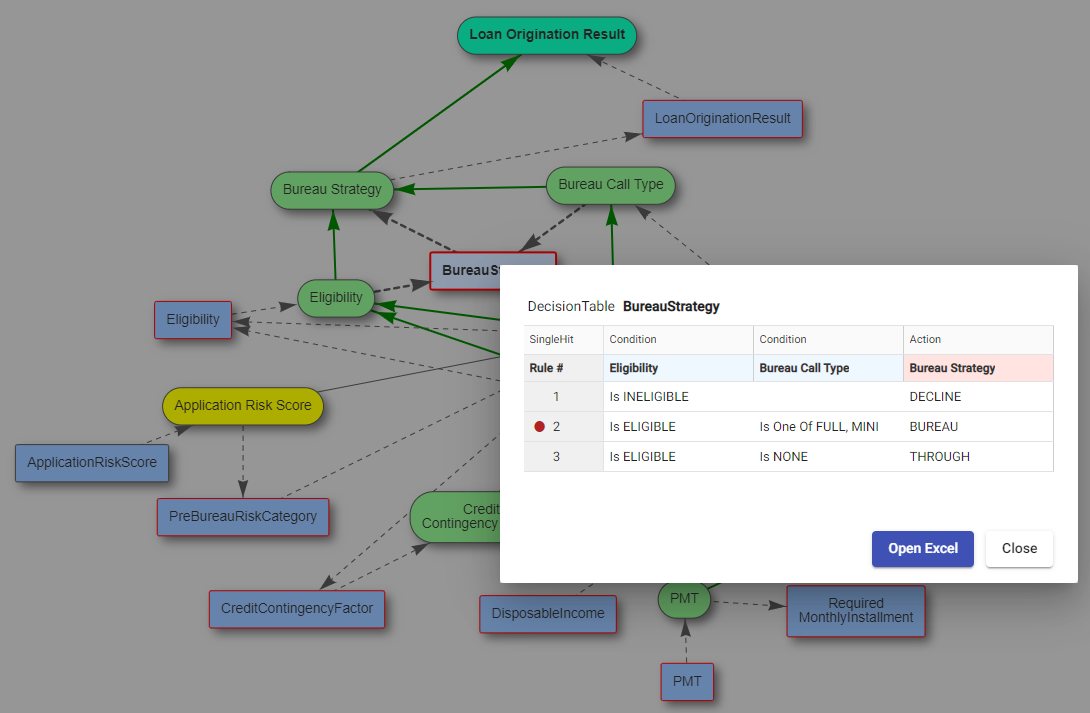
Right Panel shows the current state of the decision diagram:The nodes highlighted in orange represent the path with decision tables which are being currently executed. By a click on any yellow or white node with decision variables you would be able to see their current content like the node “Diagnoses”:

Instead of the diagram, you may decide to look at the related decision variable and their current values in the tabular format by selecting “⊗ Variables” at the top right corner:

This panel shows decision variables with their current values. If you select “Show Related Variables” you will see only those decision variables that participate in the current rule, otherwise all variables will be shown.
The values of all decision variables are shown BEFORE evaluation and possible execution of the currently selected rule!
You may continue clicking on the buttons on the top:
- “Next Rule” will execute or skip the next rule
- “Next Active Rule” will bring you to the next “green” rule that is about to be executed
- “Next Table” will bring you to the beginning of the next table
- “GoTo End/Breakpoint” will complete the execution of the selected test or will stop at the next reachable breakpoint if any
- “Restart” will start the debug session from the very beginning:

Using Breakpoints
In the above views you may see red circles near some rules. They show the breakpoints in which the Debugger will stop when you click on “GoTo End/ Breakpoint” (of course, only if it actually could reach the corresponding rule). You may set up a breakpoint by clicking on the left of the rule whether inside its Debugger’s view or in a separate decision table opened from a diagram or the execution path as below:
You can click on the left of the second rule to set a breakpoint (shown as red circle). Now if you click on the button “Restart” or run the Debugger again from any test case, you will be able to stop at this breakpoint. When you click on “GoTo End/Breakpoint“, the Debugger will execute all rules until it reaches the next breakpoint and will stop before executing the marked rule. This way you don’t need to execute rules one-by-one and may jump right to the point you need to analyze.
You may see all currently set breakpoints as you wish by selecting “Breakpoints” at the top-right corner:
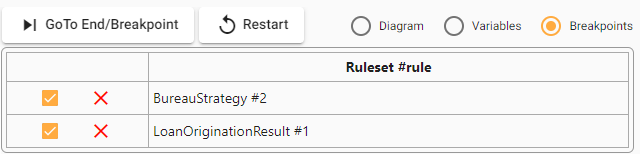
You may delete some or all of the right here by a click on the cross, or do it directly from the opened decision table.
The best way to appreciate the power and the ease-of-use of this Rule Debugger is to install OpenRules Decision Manager and try to debug standard or your own decision models.
OpenRules Debugger satisfies all requirements for the modern state-of-art easy-to-use debugging tool oriented to business users. It provides practical help to creators of business decision models when they need to understand the behavior of their models and to find bugs in the most complex logical situations.
